
Within the active life of a star, these can be classified in different ways. The best known of them is the main sequence, a state in which most of them are found during their stable combustion of hydrogen. But to better understand the main sequence, one must understand where it is framed. This framework is the Hertzsprung-Russell Diagram, either HR Diagram, which is a statistical scheme based on many observations, about the relationship between absolute magnitude of a star and its surface temperature. The main application of this diagram is to be able to distinguish some stellar types and thus better understand stellar evolution, since as has been seen, stars become 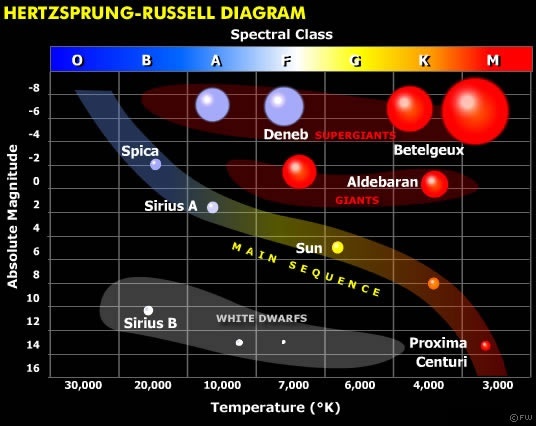 They are grouped into specific regions according to the vital period in which they are found. Click on the graphic to see it in detail.
This diagram demonstrates a progression between dwarf, yellow and cool stars, rising to the hottest and largest red and blue supergiants. The predominant region is a diagonal from the upper left region (hot and bright stars) to the lower right region (cold and less bright stars). This predominant region is the main sequence, with stable stars undergoing nuclear fusion from hydrogen to helium. Far from this region are the white dwarfs (lower left corner) and the red giants and supergiants (upper right corner); The latter include cases of stars carrying out other processes to remain stable, related to the last stages of their life.
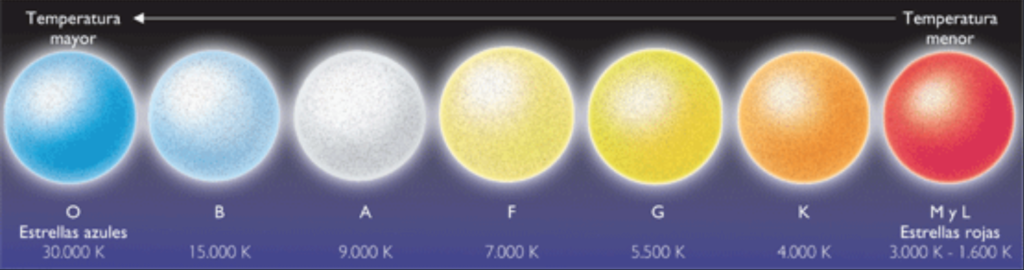
OBAFGKM series
As mentioned, the stars are classified in the HR diagram relating luminosity and temperature, according to their spectral band (the hottest go to the blue of the spectrum, and the coldest go to the red). The spectral band (the decomposition of the spectrum) is closely related to the chemical composition of the star, since it is one of the determining factors about where the star will be located on the HR diagram. Thus, between certain ranges of surface temperature and chemical elements typical of these ranges, a letter is assigned, which is subdivided into levels from 0 to 9 for average luminosity values. This series of letters is OBAFGKM, the main indicator of star rating on the HR diagram.